
Real Estate Portfolio KPIs: The Six Metrics That Matter for Occupiers

Real estate portfolio KPIs show whether your sites match your needs and what they cost relative to how they are used. For companies with their own sites, six of them matter most: cost per square metre, space efficiency, utilisation, vacancy rate, remaining lease term and energy intensity. These corporate real estate (CRE) KPIs only become meaningful in comparison, ideally with sites of the same type: warehouses with warehouses, offices with offices.
This article explains all six metrics with formulas, works through an example and lists sources for benchmarks.
Corporate real estate KPIs: why occupiers need different metrics from investors
Many real estate metrics come from the world of investors. A property fund wants to know how secure its rental income is. A company with its own plants, warehouses and offices wants to know whether its space matches its needs and what that space costs.
Lease terms show the difference most clearly. For an investor, a long lease is good news because it secures income. For a company that is itself the tenant, the same lease means a long payment obligation. From this point of view, a lease that ends soon is an opportunity to give up space, downsize or renegotiate.
Vacancy works the same way. For an investor, it means lost rent. For a company, empty space costs money and contributes nothing to operations. Good metrics for corporate real estate management therefore connect cost and use.
Real estate portfolio KPIs at a glance
| Metric | What it shows | How it is calculated |
|---|---|---|
| Cost per m² | What a site costs relative to its size | Annual costs ÷ area |
| Space efficiency | How much of the built area is usable | Usable area ÷ total floor area |
| Utilisation | How much of the usable space is actually in use | Occupied places ÷ available places |
| Vacancy rate | How much space is not used at all | Vacant area ÷ total area |
| Remaining lease term | How long a company is tied to a lease | Time until the next possible lease end |
| Energy intensity | How much energy a site uses per unit of area, the basis for its carbon footprint | Annual consumption in kWh ÷ area |
Annual costs include rent, service charges, maintenance and operations. Metrics per square metre only become comparable when all sites use the same type of area. In Germany, the DIN 277 standard distinguishes between total floor area (Brutto-Grundfläche, BGF) and usable area (Nutzungsfläche, NUF), for example. For leased space, the German Society of Property Researchers (gif) publishes its own guideline. In many companies, lettable area is the common denominator, and the report states which area it is based on.
How to calculate space efficiency
Formula: space efficiency = usable area ÷ total floor area × 100
A building with 10,000 m² of total floor area and 6,500 m² of usable area has a space efficiency of 65 per cent. The rest is taken up by walls, corridors, stairwells and building services. For office and administrative buildings, an analysis by TU Wien puts the figure at around 60 to 70 per cent. For industrial halls, the value depends heavily on the construction and equipment.
How to calculate the vacancy rate
Formula: vacancy rate = vacant area ÷ total area × 100
If 1,200 of 15,000 m² at a site are permanently empty, the vacancy rate is 8 per cent. Vacancy and low utilisation are two different things. Vacancy is a hall that nobody uses. Low utilisation can occur in a full building too, when desks, storage locations or machines are only in use part of the time.
Figures that look good and change little
A simple test shows whether a figure belongs on the portfolio overview: would a decision change if it rose by ten per cent? If not, the site's data sheet is a better place for it.
Typical examples are the total area of the portfolio, an average across all sites, and details such as year of construction or plot size. Total area says little without cost or use. An average of a plant, a warehouse and an office describes none of the sites. Figures like these still find their way into reports because they are easy to collect.
Example: when a cheap site turns out to be expensive
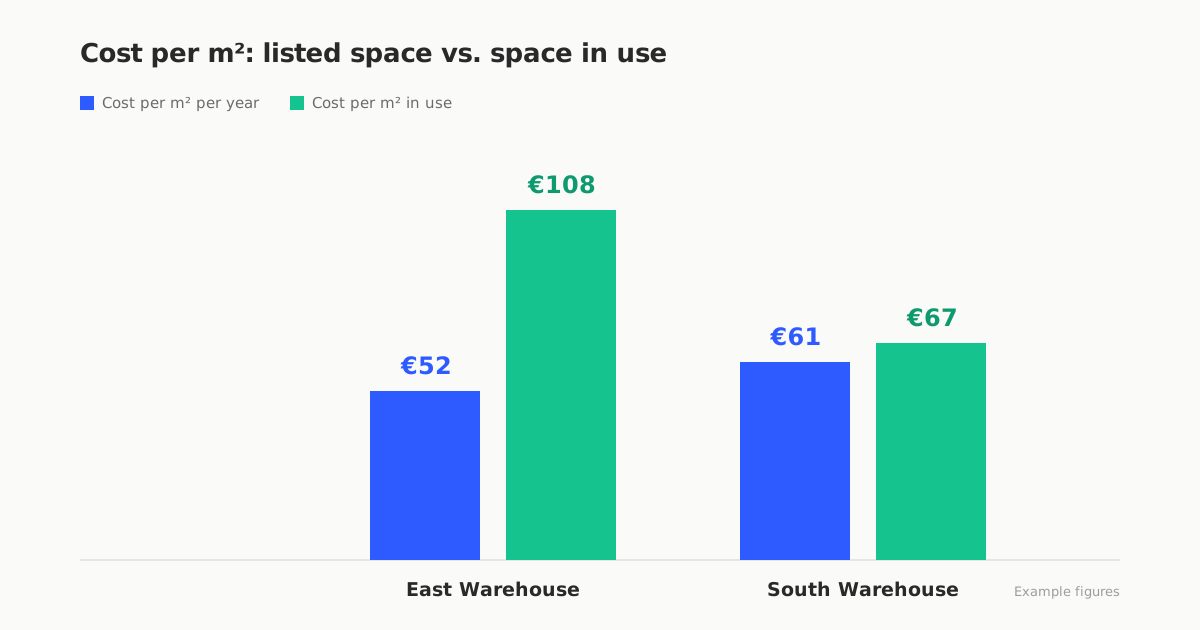
A site can be expensive and well used, or cheap and half empty. This only becomes clear when cost and utilisation are viewed together. Dividing the cost per square metre by the utilisation rate gives the cost per square metre actually in use. The figures in this example are fictitious.
| Site | Type | Cost per m² per year | Utilisation | Cost per m² in use |
|---|---|---|---|---|
| North Plant | Production | €68 | 85% | €80 |
| East Warehouse | Warehouse | €52 | 48% | €108 |
| South Warehouse | Warehouse | €61 | 91% | €67 |
| Central Office | Administration | €190 | 55% | €345 |
| Harbour Office | Administration | €210 | 92% | €228 |
At first glance, East Warehouse looks like the cheapest site. Because almost half of it is empty, it is the more expensive of the two warehouses per square metre in use. The offices tell the same story: Harbour Office costs more per square metre, yet it is almost fully used. Central Office is where action is needed.
There are two options for East Warehouse. The space can be reduced, or stock from another warehouse can move there to raise utilisation. South Warehouse is almost full at 91 per cent, so moving stock from there would ease the pressure on both sites. Which option costs less depends on the remaining lease terms. If the East Warehouse lease ends soon, downsizing is easier. If it still has a few years to run, filling the space makes more sense. Only by combining utilisation and remaining lease term do two figures turn into a decision.
Offices and warehouses cannot be compared directly. The €190 for the office and the €52 for the warehouse have nothing to do with each other. Unusual values also often come down to errors in the data, such as a different reference area or a missing invoice.
Benchmarks: plenty for offices, very few for industrial buildings
For offices, some published benchmarks exist. According to CBRE's 2026 Global Workplace and Occupancy Insights, average office utilisation worldwide is 53 per cent, and many companies aim for more than 65 per cent. In Germany, official reference values for the energy consumption of non-residential buildings are available by building category. For plants and warehouses, freely available figures are largely missing, so a comparison between your own sites of the same type is the most reliable yardstick.
Utilisation deserves a second look. According to the same study, peak utilisation reaches 80 per cent. Planning space around the average leaves too little room on peak days. Planning around the peak leaves a lot of space empty on the other days. Only both figures together give the full picture.
How often a portfolio review makes sense
Utilisation changes fastest, so a quarterly review makes sense here. For the other metrics, an annual review is enough, ideally in line with budget planning. Lease end dates become relevant before the notice period starts.
For a first portfolio analysis, the data that already exists is usually enough. Gaps can be flagged and closed over time.
With spaciv's portfolio strategy, you can see these metrics for all your sites in one shared data model with consistent definitions, grouped by site type, and share them as a dashboard, for example with senior management.
Frequently asked questions
Which KPIs do you need in corporate real estate management?
Six are usually enough: cost per square metre, space efficiency, utilisation, vacancy rate, remaining lease term and energy intensity. What matters most is that all sites use the same type of area and that only sites of the same type are compared.
What is a good space utilisation rate?
There is no fixed figure, because offices, warehouses and production areas are measured differently. For offices, CBRE puts the global average at 53 per cent. For warehouses and production, a comparison with your own sites tells you more.